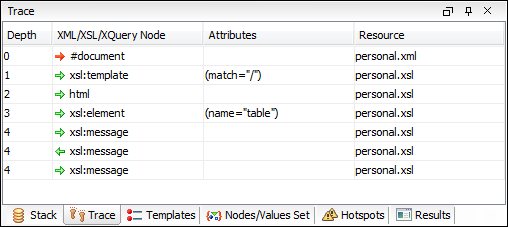
Trace View
Usually, the XSLT/XQuery processors signal the following events during transformation:
 -
Entering a source (XML) node.
 -
Leaving a source (XML) node.
 -
Entering an XSLT/XQuery node.
 -
Leaving an XSLT/XQuery node.
The Trace view catches all of these events, so you can see how the process evolved. If the view is not displayed, it can be opened by selecting it from the menu.
The red icon lines denote source nodes while the green icon lines denote XSLT/XQuery nodes. It is possible to save the element trace in a structured XML document (using the Export to XML action in the contextual menu). Thus, you have the possibility of comparing the trace results from multiple debug sessions.

The contextual menu contains the following actions:
- Go to
- Moves the selection in the editor panel to the line containing the XSLT element or XML element that is displayed on the selected line from the view;
- Export to XML
- Saves the entire trace list in XML format.
| Column | Description |
|---|---|
| Depth | Shows you how deep the node is nested in the XML or stylesheet structure. The bigger the number, the more nested the node is. A depth 0 node is the document root. |
| XML/XSLT/XQuery Node | Represents the node from the processed source or stylesheet document. One particular node is the document root, noted as #document. Every node is preceded by an arrow that represents what action was performed on it (entering or leaving the node). |
| Attributes | Attributes of the node (a list of id="value" pairs). |
| Resource | Resource file where the node is located. The complete path of the resource file is provided as tooltip. |
Important: Remarks:
- Clicking a record highlights that node's location inside the resource.
- Only the Saxon processor shows the element attributes.
- The Xalan processor shows also the built-in rules.
