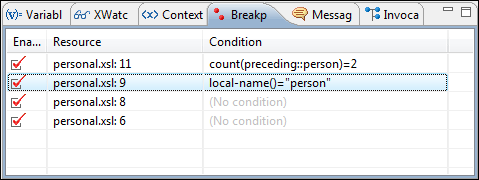
Breakpoints View
The Breakpoints view lists all breakpoints that are set on open documents. If the view is not displayed, it can be opened by selecting it from the menu. Breakpoints can be inserted in the XML source document or the XSLT/XQuery document in debugging sessions.
Once you insert a breakpoint, it is automatically added to the list in the Breakpoints view and you can edit its associated condition. A breakpoint can have an associated break condition that represents an XPath expression evaluated in the current debugger context. For them to be processed, their evaluation result should be a boolean value. A breakpoint with an associated condition only stops the execution of the Debugger if the breakpoint condition is evaluated as true.

- Enabled - If selected, the current condition is evaluated and taken into account.
- Resource - Resource file and number of the line where the breakpoint is set.
- Condition - XSLT/XQuery expression to be evaluated during debugging. The expression will be evaluated at every debug step.
Clicking a record highlights the breakpoint line in the document.
- Go to
- Moves the cursor to the source of the breakpoint.
- Run to Breakpoint
- Runs the debugger up to the point of this particular breakpoint and ignores the others (regardless of whether they were previously enabled or disabled).
- Enable
- Enables the breakpoint.
- Disable
- Disables the breakpoint. A disabled breakpoint will not be evaluated by the Debugger.
- Add
- Allows you to add a new breakpoint and breakpoint condition.
- Edit
- Allows you to edit an existing breakpoint.
- Remove
- Deletes the selected breakpoint.
- Enable all
- Enables all breakpoints.
- Disable all
- Disables all breakpoints.
- Remove all
- Removes all breakpoints.
