Debugging the CSS
If you notice that some of the CSS properties were not applied as expected, some of the tips offered in this topic might help you with the debugging process.
CAUTION:
Do not modify the built-in rules directly in the CSS
files from the Oxygen XML Editor/Author installation. Instead, copy the rules to your
own customization CSS.
Comparing the CSS Against the Input File
The first thing that you should try is to check the file structure of the input XML or HTML file and compare it to the CSS selectors to make sure they are written correctly against the document structure. If you still cannot identify the problem, then inspect how the styles are applied (you can try any of the methods listed below).
Inspecting the Applied Styles Using a Browser
The following procedure explains how to inspect the applied CSS styles using
Chrome, but any modern browser can be used and the procedure for each of them is
similar:
- Open the XML or HTML file.
- Open the Chrome Developer Tools by using (or press CTRL+SHIFT+I).
- Activate the Rendering
pane by using then select print from the Emulate CSS
media section. This will activate the CSS selectors enclosed in
@media print {..}:
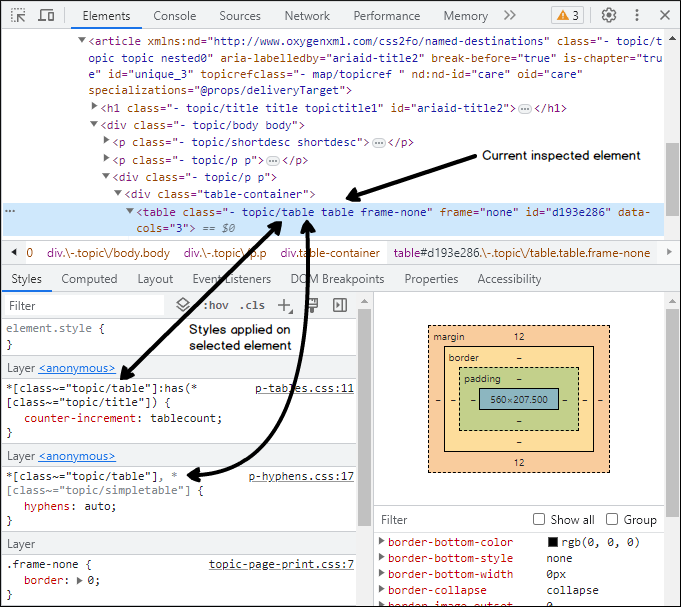
Note:This allows you to debug the styling of elements, the table of contents, and the index, but not the styles of the page margin boxes (headers, footers) or page breaks. - Right-click on the element you want to inspect and select the Inspect action. You
will see the element (in the Elements pane) and the list of styles that are applied
on it (in the Styles pane):

Tip:Clicking any of the stylesheet links from the Styles pane opens the original CSS files in the Sources pane. Editing the rules in that pane results in a live preview of how the change will affect the output (these modifications will be lost on reload).
Inspecting the Applied Styles Using Oxygen XML Editor/Author
To inspect the applied CSS styles using Oxygen:
- In Oxygen XML Editor/Author, open the XML or HTML file.
- From the Styles toolbar, choose the
+ Print Ready entry. This will activate certain CSS selectors
enclosed in
@media print {..}.Note:This allows you to debug the styling of elements, the table of contents, and the index, but not the styles of the page margin boxes (headers, footers) or page breaks. - Right-click on the element you want to inspect and select the
Inspect Styles action. The dedicated CSS
Inspector view will be opened and it will show the applied CSS rules.Tip:With this file open in Author mode, it might be helpful to switch the Tags Display Mode to
 Full
Tags with Attributes. You might be able to identify the selector you need
to style without using the CSS Inspector view.
Other Debugging Techniques
Here are some other debugging techniques you may find useful:
- Add background and border properties to the specific CSS rule. If they do not appear in the output, then there is a problem with the rule selector.
- Add the
!importantkeyword to a property that is not applied, or make the selector more specific (by adding more parent selectors). - Add the following fragment in your customization CSS to show how the
elements are mapped to
PDF:
This will show the element name, its class attribute, and will paint a blue border around each of the elements in the output. It will not show the page margin boxes or some content elements that are hidden.* { border: 1pt solid blue !important; } *:before(1000) { content: oxy_name() !important; color: orange; } *:before(900) { content: "[ class= '" attr(class) "'] " !important; color: orange; }

