Dashboard Page
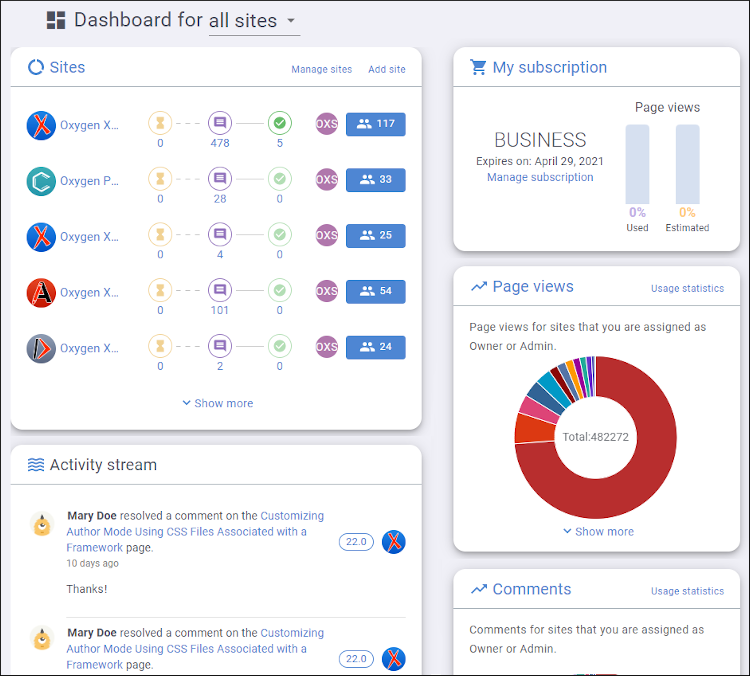
The first time you log in to the administration interface, you are directed to a Welcome page where you can click the Add your first site button to create your first site configuration. After you have created at least one site configuration, you start with the Dashboard page on all subsequent logins. This page is especially helpful for those who integrate the Feedback commenting component in multiple websites. It aggregates basic information about your existing site configurations.
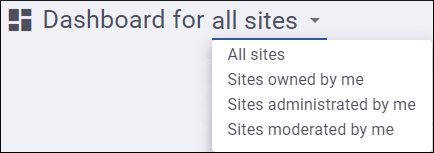
There is a drop-down menu at the top that you can use to filter the Dashboard by all your site configurations, or sites that you are assigned as the Owner, or sites that you are assigned as an Admin or Moderator.
The Dashboard contains the following panes:
- Sites
-
The Sites pane displays all the existing site configurations along with information such as the Owner. The site configurations with pending comments are listed first, and then the rest are sorted alphabetically.
The following components are available in this pane to help you filter the information or navigate to a certain page:- If you click the Sites title in the top-left corner of the pane or if you click the Manage sites link in the top-right corner of the pane, you will be directed to the Sites page where all your site configurations are displayed in a tile format.
- You can click the Add site link in the top-right corner or the pane to create a new site configuration.
- If you click on the name of the site configuration, it will open the Comments page where comments can be moderated and managed for the particular configuration.
- The number of Pending (not shown if the Comments Moderation option is set to
None), Open, and
Resolved comments are displayed for each site
configuration. You can click the icon or number to open the Comments page
with the comments automatically filtered based on the status you click.Note: The number of Open and Resolved comments do not include replies (only first-level comments).
- The avatar for the site Owner is displayed on the right side. You can hover the avatar to see the name of the Owner.
- The number of community members is displayed in a blue box on the far right for each site configuration. Clicking the blue box will open the Community page where you can see all the members of the site management team and any other user who has posted a comment for the particular site configuration.
- By default, five site configurations are shown, but you can click the Show more link at the bottom of the pane to show the rest of the sites.
- Activity Stream
-
The Activity Stream displays all the activity for the site configurations including information about the person who made the change and details about each activity.
Each activity box includes the name and avatar of the commenter, a link to the actual topic in the published output where the comment resides, the version of the site configuration (clicking the version opens the Comments page with the comments automatically filtered based on the version), and the avatar for the site configuration.
- My Subscription
- This pane displays information about your current subscription, including the expiration date and the percentage of used and estimated Page Views for the current period. You can click the Manage subscription link to open the Subscription Plans page where you can see more details and make changes to your subscription.
- Page Views
- This pane displays the number of page views for all site configurations that you are assigned as the Owner or Admin. You can click the Usage statistics link in the top-right corner to open the Usage Statistics page where they can see the number of Page Views and comments added for all of your site configurations.
- Comments
- This pane displays the number of comments added in all site configurations that you are assigned as the Owner or Admin. You can click the Usage statistics link in the top-right corner to open the Usage Statistics page where they can see the number of page views and comments added for all of your site configurations.