Site Usage Statistics
The Site Usage Statistics page is where you can see
various statistics for a particular site configuration. Users with a role of Owner or
Admin can reach this page by clicking the  Site usage link
in the left menu bar in the interface for the particular site configuration.
Site usage link
in the left menu bar in the interface for the particular site configuration.
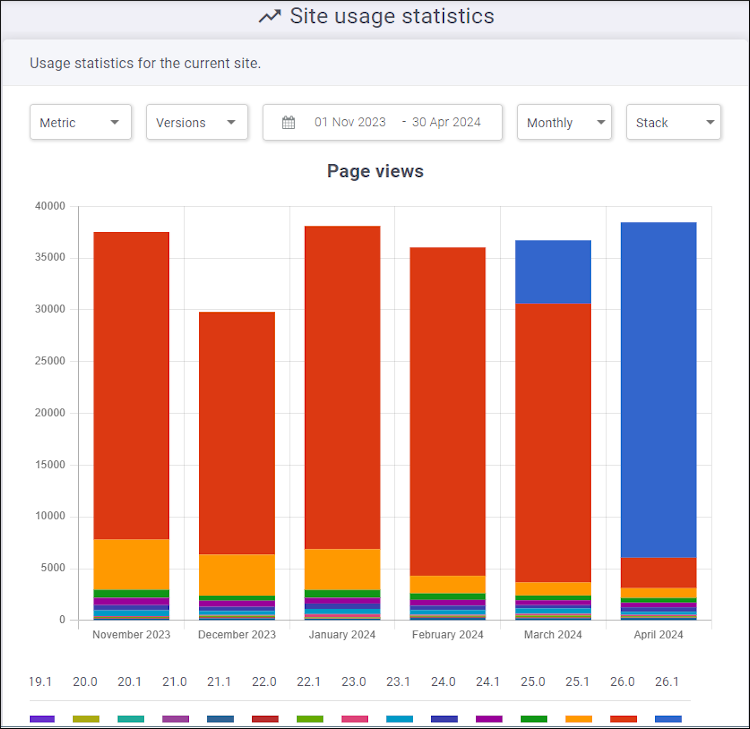
This statistics page includes filtering options at the top of the page for choosing the type of data to be displayed. The top part of the page displays statistics for page views and/or comments in a graph form according to the selected filtering options. This is followed by a table with numeric statistics for each selected version. You can click the up or down arrow to the right of the title for each column header to sort that particular column. By default, the table is sorted in the descending order of the number of page views from the last column of the table (last month or last day of the selected period). The last table shows statistics for the most popular pages.
The filtering options at the top of the page include:
- Metrics
- You can select the type of metric to be displayed. You can choose between Page views, Comments, AI Assistant Sessions, AI Assistant Users, or AI Assistant Threads.
- Versions
- You can choose which versions to have their statistics displayed for the site configuration.
- Date Chooser
- You can select the time period to be displayed. You can choose a relative period (current month, last week, last month, last 3 months, last 6 months, and last year) or you can select a custom period. The default time period is automatically selected based upon the amount of data that is found in past intervals of 2, 5, or 11 months (plus the amount of past days in the current month). For example, if there is data found only in the last 2 months, the default selected time period encompasses all the past days in the current month plus the entire 2 months prior to the current month. If there is data found in the past 11 months, then the default encompasses all the past days in the current month plus the entire 11 months prior.
- Aggregate Chooser
- You can choose between Daily or Monthly for the type of aggregation to be displayed.
- Chart Type Chooser
-
You can select the type of the chart to be displayed. You can choose between Line, Bar, and Stack.
Below the main chart, there is an expandable Data Grid section that displays numerical statistics for each selected site configuration, based on the chosen Metric.
Most of the metrics also include a table with additional statistics below the Data Grid section, such as information about the most popular pages or statistics about AI Assistant sessions, users, or threads. Note that for the AI Assistant Sessions and AI Assistant Threads metrics, the table includes a column that shows the average number of tokens consumed by the AI Assistant per session.